// Case StudyDashboards
Back to Cases04 — Project Details
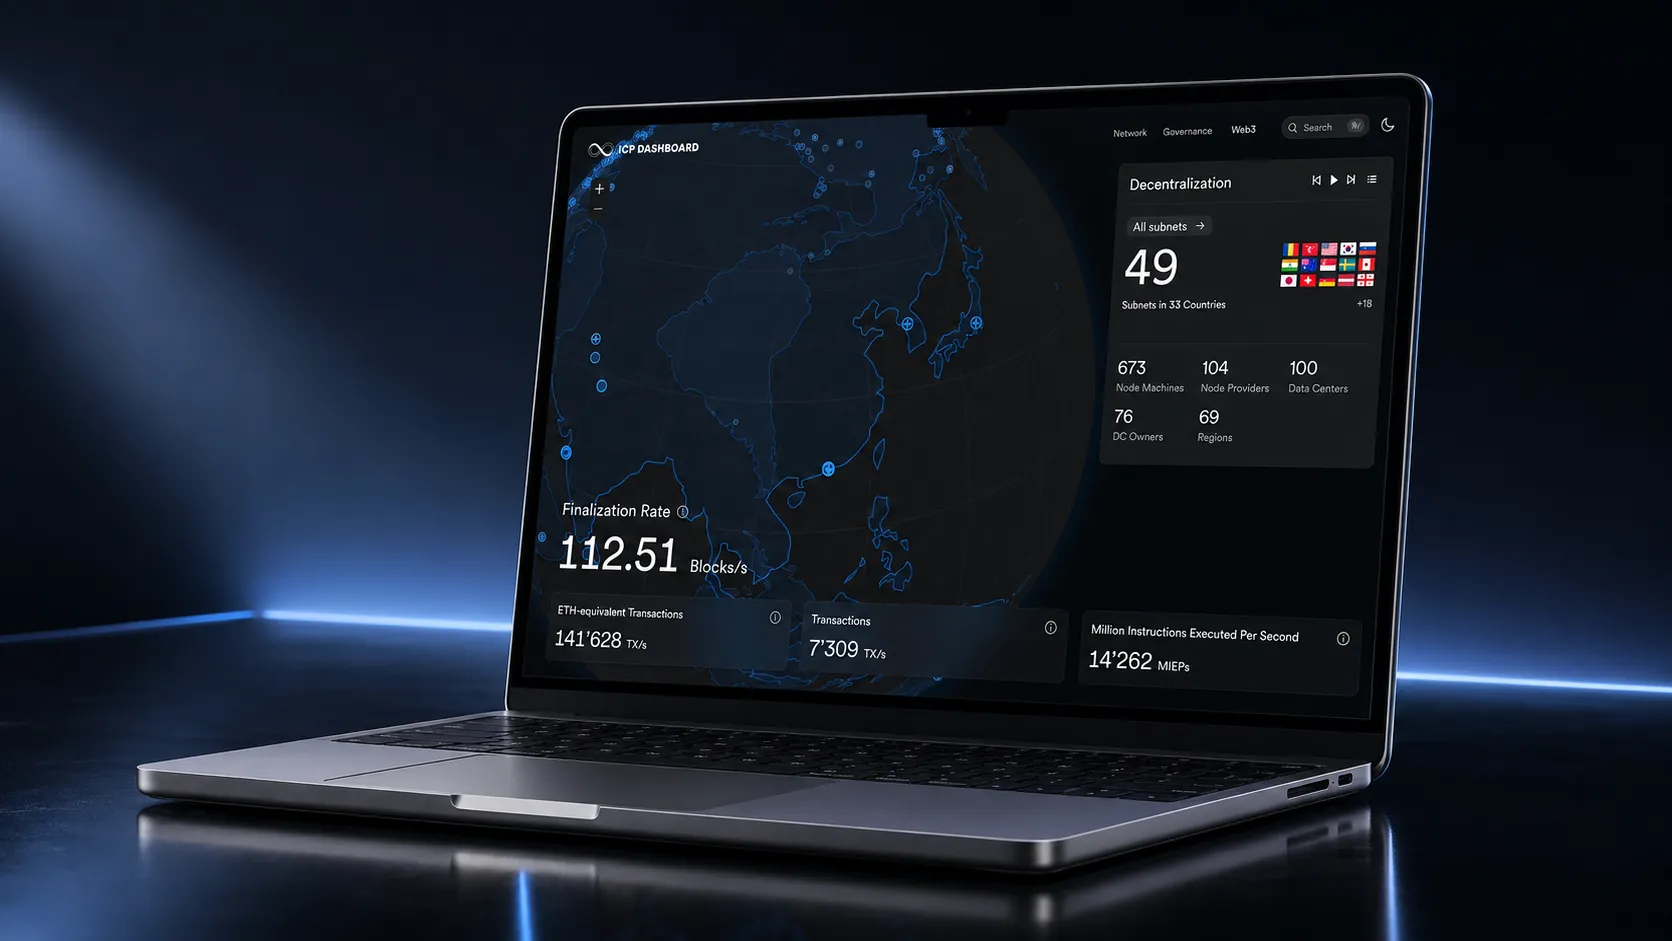
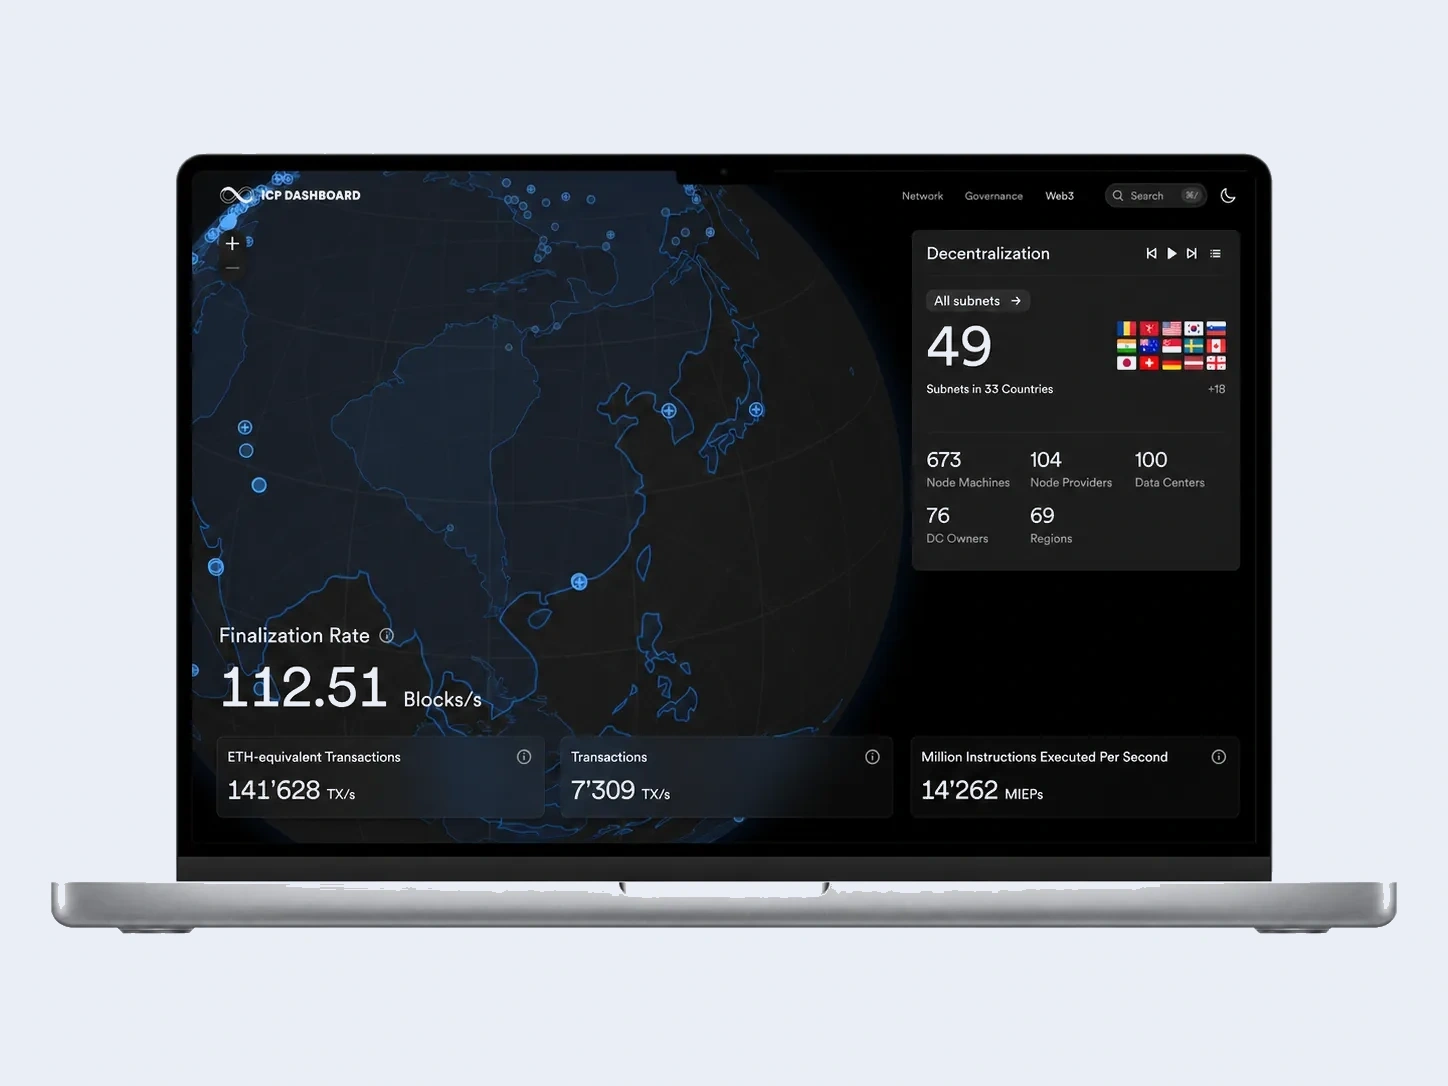
ICP Dashboard
A comprehensive analytics dashboard for the Internet Computer Protocol.
// DisciplineDashboards
// Deliverables
- UI/UX Design
- Data Visualization
- Web App Design
// Tags
Web3AnalyticsBlockchain
// The Challenge
Visualizing complex blockchain network metrics, node status, and governance data in real-time.
// Project Goal
Design a unified, high-performance dashboard that provides transparency into the Internet Computer ecosystem.
// The Process
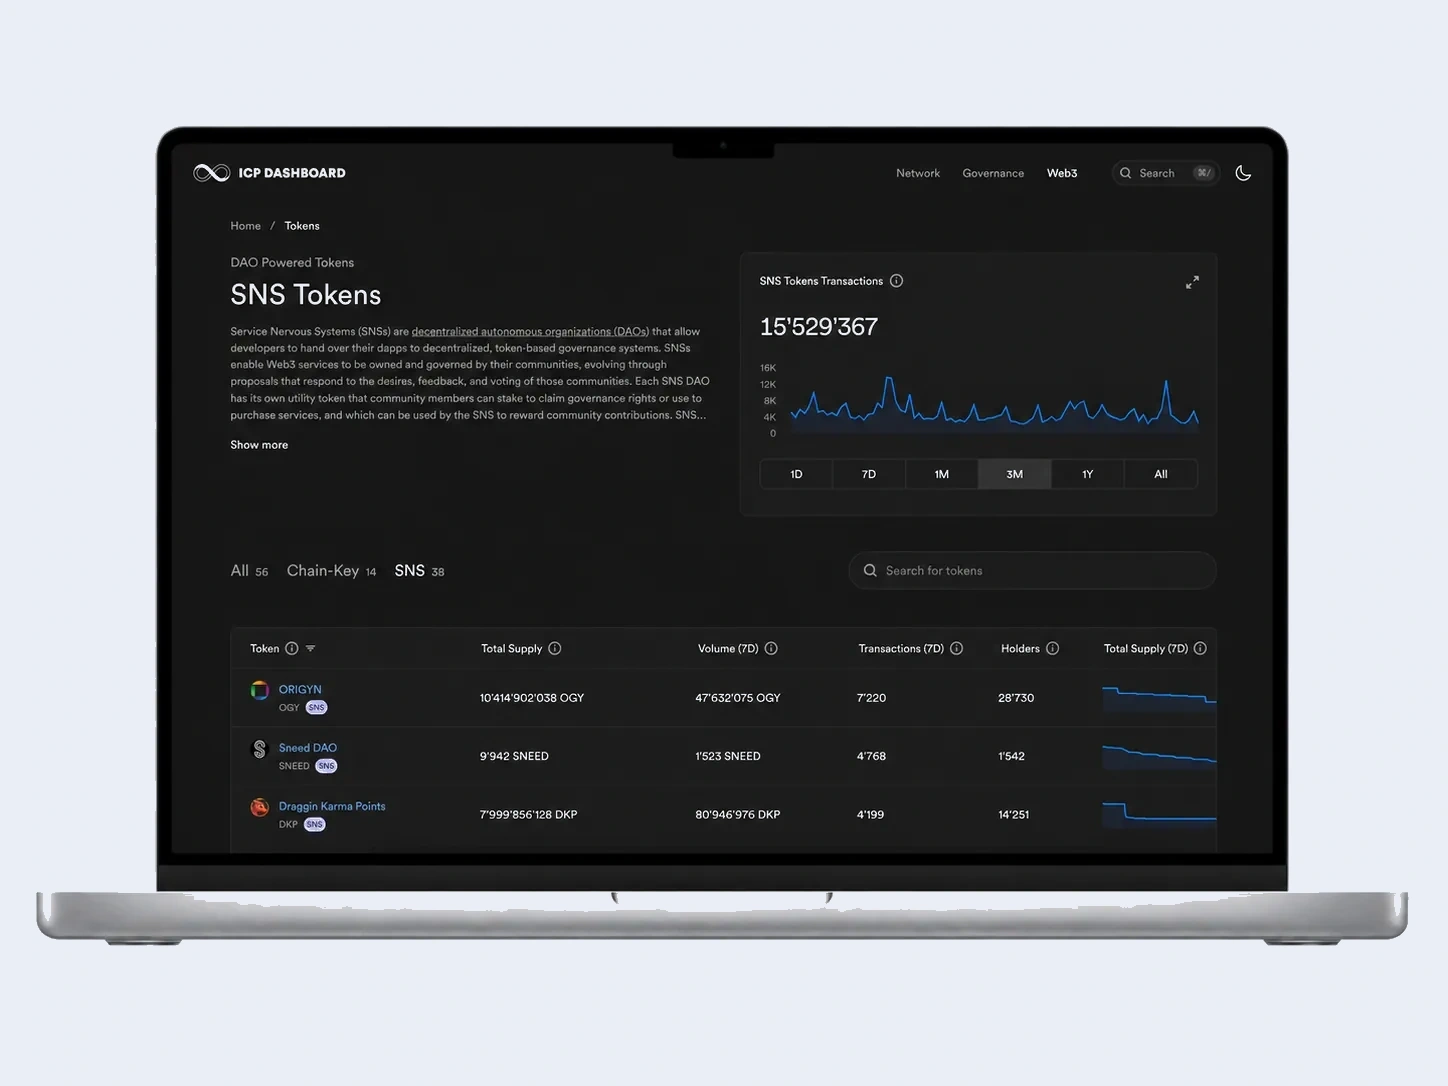
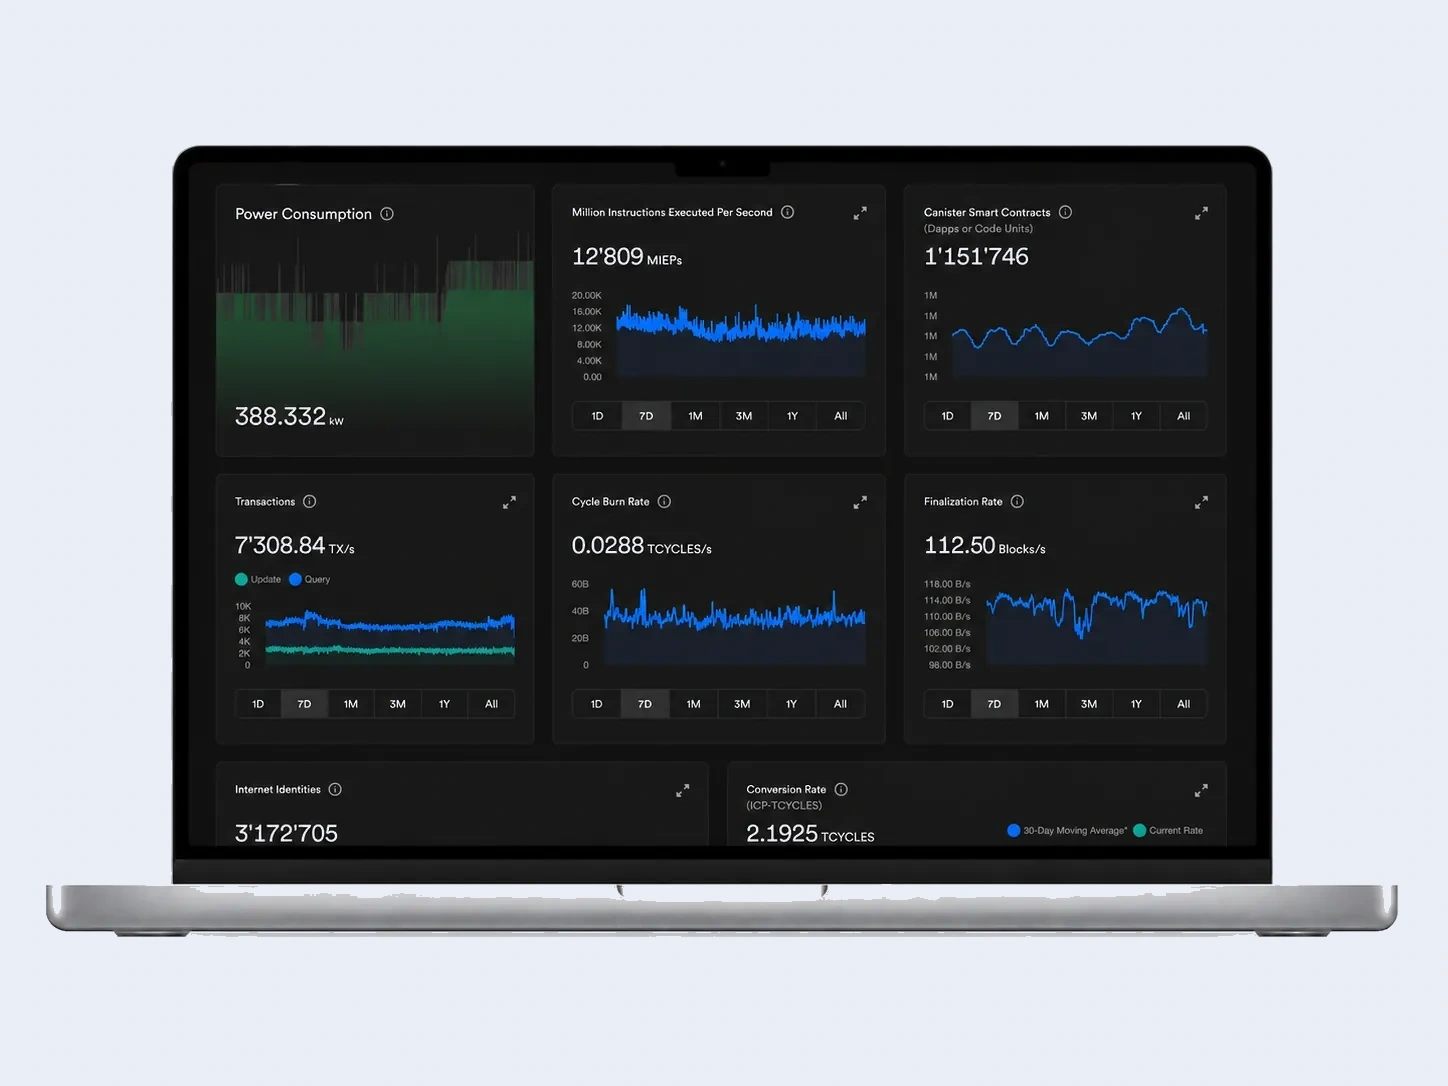
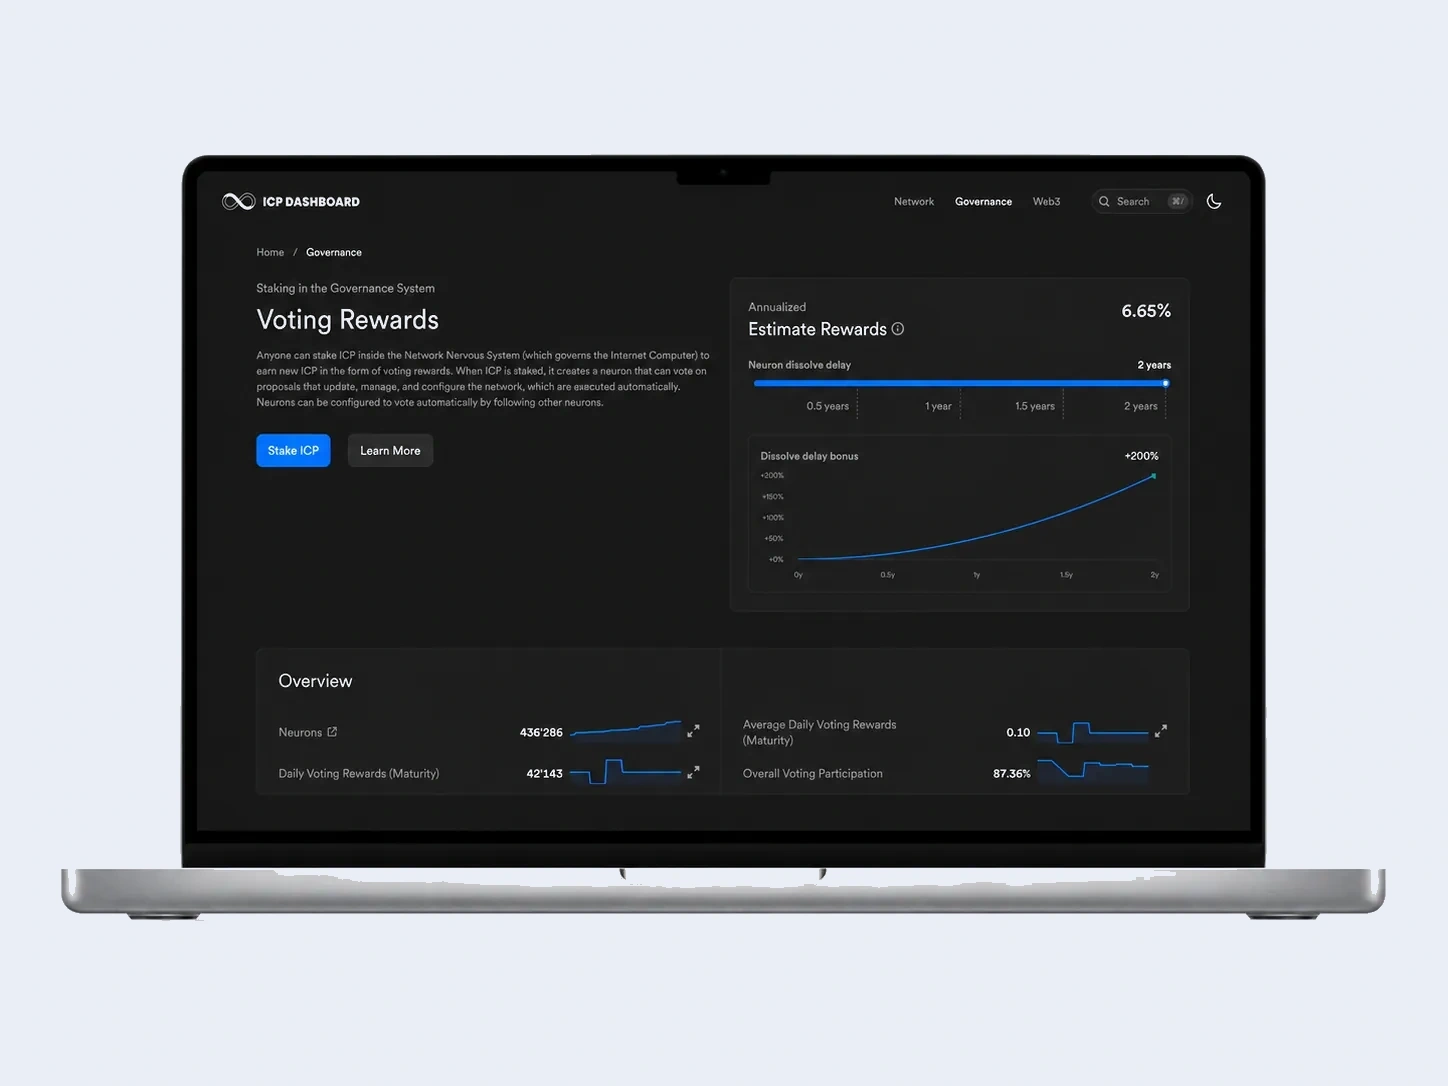
We structured the interface around key metrics (transactions, power consumption, voting rewards) and designed bespoke chart components.
// The Solution
A dark-themed, data-dense interface that translates massive amounts of on-chain data into legible, actionable insights.
// Scope of Work
- Dashboard UI
- Data Visualization System
- Component Library
// Design Outcome
Design outcome: Delivered a scalable analytics interface that handles live blockchain data, featuring complex charting and clear data hierarchies.
// Browse Other WorkAll Cases